Net Promoter Score Insider Guide: NPS Secrets and Best Practices
After being introduced in 2003 by Fred Reichheld in Harvard Business Review, the Net Promoter Score (NPS) took the business world by the storm. Today, two-thirds of large companies track and report their Net Promoter Score, and I was one of the people who set up NPS surveys and analyzed the results.
My experience covers NPS and customer satisfaction tracking for two Fortune 500 consumer companies in the retail and telecommunication industries. In this article, I share my direct and intimate knowledge of the data and speak honestly about NPS and how to use it as a corporate practitioner.
For those already familiar with the Net Promoter Score, this is the summary of my main points (TL/DR):
- Both NPS and customer satisfaction (CSAT) measure the same thing. They are not materially different.
- High Net Promoter Score does not predict growth.
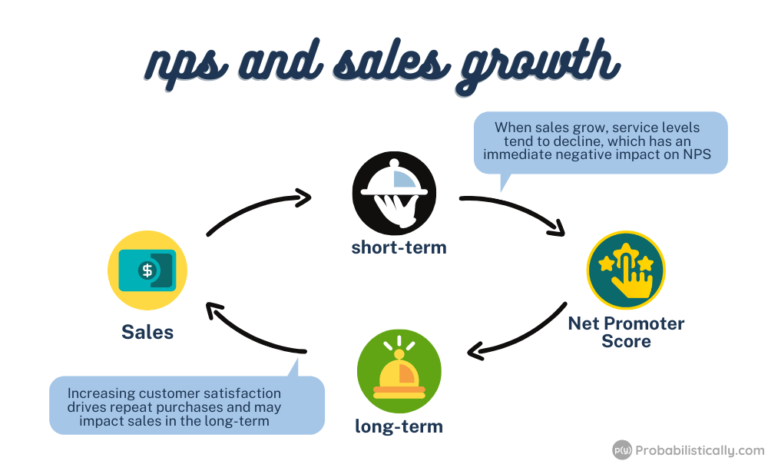
- For brick and mortar locations and non-digital services, an increase in NPS is strongly associated with a short-term decline in sales. When the stores get busy, customer service tends to suffer, and vice versa. This drives the negative correlation.
- NPS is highly dependent on the industry, and it is not correlated with the industry’s growth. I worked for both retail companies with a world-class high NPS and universally hated cable companies with NPS in the negative numbers. As an industry, retail lost sales, and cable companies have grown their revenues. I saw no evidence of NPS impacting sales.
- Using driver or attribute ratings to explain NPS/CSAT is challenging due to the horn and halo effect. While satisfaction with a driver attribute impacts the overall satisfaction, the overall satisfaction, in turn, rubs off on all other attributes. Those who love your brand tend to love everything about it, and those who hate it, dislike everything by association.
What is Net Promoter Score
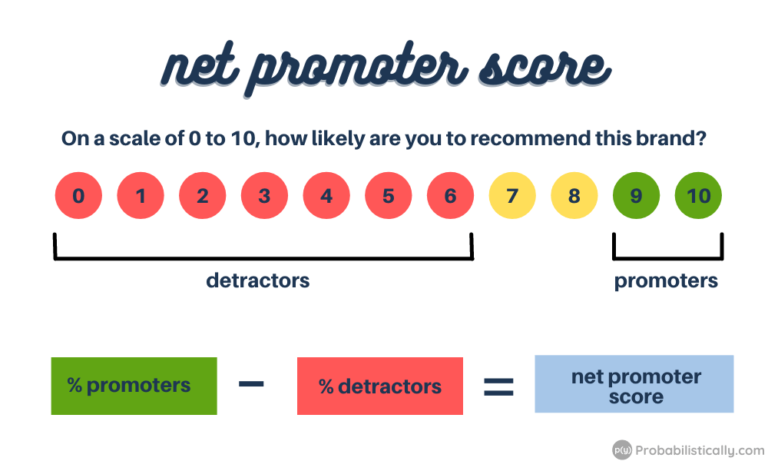
The Net Promoter Score (NPS) is calculated by subtracting Detractors from Promoters. Promoters are customers who rate your brand 10 or 9 when answering the question “On a scale of 0 to 10, how likely are you to recommend this brand?”, and Detractors are those who rate it 0-6.

In his article, Fred Reichheld claimed that NPS is a measure of customer loyalty. This gives me a pause because, in consumer research, loyalty is measured by the likelihood to repurchase, not to recommend. However, the author redefined loyalty to help him breach this gap.
Loyalty is the willingness of someone—a customer, an employee, a friend—to make an investment or personal sacrifice in order to strengthen a relationship.
— Fred Reichheld, The One Number You Need to Grow, HBR, December 2003
Does that sound like brand loyalty to you? Maybe.
I would agree that consumers willing to drive an extra mile to purchase their preferred brand are loyal. But attaching a big word like “sacrifice” to the willingness to recommend a product to a friend does sound like a stretch.
What happened over the years since the article was published proves the point. While NPS was widely accepted as a KPI, it is not considered a measure of loyalty by most brands.
Net Promoter Score vs Customer Satisfaction
The central claim of Reichheld’s article was that the Net Promoter Score was superior to customer satisfaction in predicting the brand’s growth.
By substituting a single question for the complex black box of the typical customer satisfaction survey, companies can actually put consumer survey results to use and focus employees on the task of stimulating growth.
— Fred Reichheld, The One Number You Need to Grow, HBR, December 2003
However, further research did not confirm this assertion. Many academics and leading consultants agree that the NPS question is not superior to customer satisfaction in terms of growth prediction. When researchers tested this hypothesis, they looked at the data from ratings of multiple consumer brands and compared them to their subsequent growth.
And here lies the problem.
Regardless of whether NPS or CSAT are used, most companies don’t compare their scores to other brands.
When a company implements an NPS or customer satisfaction tracking program, it usually gets detailed ratings of its own brands/products, but not that of the competition. In fact, competitive NPS is usually reported by outside agencies and is not part of corporate tracking.
Context matters, and within the context of a typical corporate research study, the debate of NPS vs SCAT is focused on which KPI is the best for improving customer experience.
Companies draw insights from NPS/CSAT by looking at the differences by geography, product lines, or sales channels. Their goal is to tease out the actions that will boost customer satisfaction over time, and they may even ponder whether to include NPS as a factor in the compensation plan.
These are practical, valid applications of the data, and for these applications, customer satisfaction is not inferior to NPS. It’s equivalent.
Through my work running customer satisfaction surveys for a major US retail chain, I was fortunate to analyze hundreds of thousands of consumer responses that included both NPS and customer satisfaction scores. With that much data, I was able to calculate monthly NPS and CSAT at a market level for a hundred markets, with enviable precision.
Comparing NPS to the standard CSAT metric, the Top 2 Box, I found that satisfaction scores and NPS were over 95% correlated. Whichever way I split the data, i.e. time periods, locations, languages, the result was always the same.
For all practical purposes, the Net Promoter Score and Customer Satisfaction measure the same thing. This is one piece of information, encoded differently, similar to the temperature that can be measured either in degrees of Fahrenheit or Celsius.
The Real Difference Between NPS and Customer Satisfaction
By the nature of its formula, NPS can only be calculated for a group of customers. Customer satisfaction is an individual metric, and unlike NPS, it can be used for respondent-level analysis and modeling.
Customer satisfaction score provides greater flexibility in the use of the data, and this should be taken into account when creating a tracking program. As an alternative to NPS, the raw Likelihood to Recommend score can be used at a responder level.
For the rest of the article, I will use NPS and customer satisfaction interchangeably. My claims about NPS can and should be applied to customer satisfaction, and vice versa.
History of NPS and Its Criticism
Fred Reichheld claimed that brands with high NPS will increase their market share over time. High NPS meant that consumers spread the word about the company, which in turn drove sales.
The article followed 2000 Malcolm Gladwell’s blockbuster The Tipping Point, which argued that “ideas and products and messages and behaviors spread like viruses do.” The book kicked off the era of Buzz Marketing. Companies praised the power of the whisper networks, where customer-to-consumer recommendations were the main driver of growth.
Reichheld’s work was published in 2003 and fully capitalized on the whisper marketing trend. The concept spread like a wildfire and most large companies now track and report NPS as one of their KPIs.
However, within a few years, academics and market researchers began to question whether it was truly the gold standard.
In the 2019 HBR article Where Net Promoter Score Goes Wrong, Christina Stahlkopf highlights the most significant criticisms of NPS. Her first point is that NPS measures intent to recommend, not actual recommendations.
This is a valid point, and it applies to many market research methods, not just NPS tracking. Unlike other methods, e.g. conjoint analysis, where purchase intent is used to produce sales estimates, NPS is not used to estimate the actual number of recommendations a brand receives.
This criticism of NPS is common, but I am not sure it can be used to enhance corporate NPS tracking programs, given that most companies simply use NPS in the same manner as customer satisfaction.
Another valid issue with NPS discussed by Stahlkopf was that the score does not capture how human relationships with brands and products can be complicated, even contradictory. Twitter is the example she uses, and it’s an excellent case of a love-hate relationship for many users.
This lack of nuance exists in most quantitative market research, and as we now know, the arbitrary measurement approach does not prevent NPS from being equivalent to CSAT.
It’s hard to create scales and methodologies that effectively capture the complex nature of consumer relationships with brands, even under the best of circumstances, let alone in a short satisfaction tracker.
Stahlkopf’s last argument is that the distribution of promoters, detractors, and passives can be different for brands with the same NPS. However, in the context of a corporate tracking program, this criticism is hardly applicable because these programs do not typically compare scores among multiple brands.
Practically speaking, when Burger King runs a customer satisfaction survey, it is irrelevant whether response distribution is similar to that of American Express or not. This comparison may be interesting for an academic researcher, but it does not help Burger King understand how to improve their customer sat.
Since overall NPS levels are industry-dependent, the scores should only be compared within one industry. And even then, these comparisons are not entirely actionable, since recommendations for future improvements usually come from the breakdown of NPS by company-specific factors such as products, regions, and customer service levels.
Now that I reviewed the common industry critiques, let me introduce my own.
NPS can be extremely confusing and hard to interpret, and it all comes down to the original claim that high NPS predicts sales and profit growth.
Does NPS Predict Growth?
Based on my experience running an NPS tracking program, a high or increasing Net Promoter Score does not predict future sales growth. In the short term, the opposite is often true: an increase in sales leads to a decline in NPS, as customer service struggles to keep up with the workload.
As startling as this conclusion is, I am not the only one reaching it. I confirmed this finding with other corporate researchers, and the agreement was that the relationship between satisfaction and sales is a two-way road.
An increase or decline in sales impacts customer satisfaction directly, immediately, and profoundly. Customer satisfaction possibly impacts sales over a longer period of time. I used the word “possibly” because I have yet to meet a researcher who was able to reliably estimate this effect.

As a general rule, measuring a long-term impact is more challenging than measuring a short-term impact. In the case of NPS, the magnitude of the short-term effect is large, so it is difficult to isolate a less pronounced long-term effect, except in special circumstances.
Putting measurement difficulties aside, this sales-vs-satisfaction conundrum means that NPS can appear deflated for fast-growing brands and products.
NPS and Industry Comparisons
NPS is industry-dependent, and thus it is not comparable among different sectors. This has several implications for the use of the data.
I happen to have worked in two industries that were on the opposite ends of the NPS spectrum: a retail company that had a world-class high NPS, and a cable company, where NPS rarely raised its ugly head from the negative gutter.
Both companies had a dedicated workforce of tens of thousands of employees, both cared about their NPS and customer experience, but being in such outlier positions, in my opinion, created a drag on the effective use of the score.
While the retail company mostly used NPS to boost morale, the cable provider was in a perpetual search of a silver bullet that would magically improve its NPS. Neither one presented an optimal use of the data.
My last point is fairly obvious, but it needs to be said: average industry NPS does not correlate to the growth rate of the industry. Remember, retail stores have some of the highest NPS recorded. Maybe it’s because the stores are often empty.
Drivers of Net Promoter Score
NPS surveys often include a driver section where the respondents rate their satisfaction with the attributes of the brand, such as pricing, product quality, and service levels.
Researchers use these questions to figure out what drives NPS. Or so they like to say.
Indeed, customer satisfaction is usually driven by a few main factors. However, in surveys, low satisfaction tends to rub off on other attributes, even though the customer did not have an issue with them.
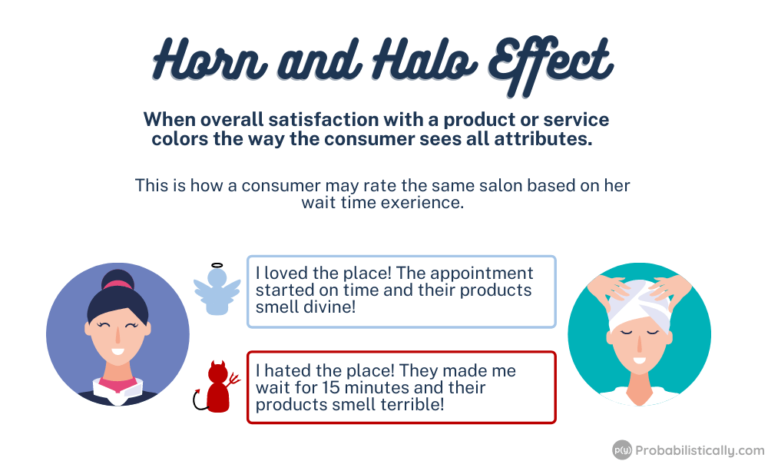
What we have here is another two-way road, and this one is sometimes called the “horn and halo effect.” This effect is a cognitive bias that makes the scores for all attributes of your brand move up and down together, tied to the topline satisfaction or NPS of the brand.
Customers who love your brand, love everything about it. Customers who hate your brand, hate all of its attributes.

I observed an interesting case of this bias when looking into customer satisfaction with store hours. In this analysis, I had to split stores into groups based on when they were open, and the company had a group of large stores that were open 24 hours. The customers of these 24-hour stores rated their experience with the store hours, and the ratings were very much correlated to their overall satisfaction scores.
This horn and halo effect is observed in many market research studies, beyond customer satisfaction, and as a result, it’s difficult to identify true drivers of customer satisfaction. This puts limitations on the value of driver analysis in market research.
In fact, satisfaction tracking is less impacted by the horn and halo effect because of its temporal nature. It is possible to compare driver ratings over time, and an experienced researcher is often able to get value out of this data. Other types of research do not have this longitudinal advantage, so it is a good idea to look out for horns and halos in every survey.
Net Promoter Score Measurement Best Practices
With these best practice tips, you can learn more about your business and get better value out of customer satisfaction and NPS surveys.
- Choose your KPI and stick with it. Consistency is more important than having the perfect metric, given that both NPS and CSAT essentially measure the same thing.
- Finalize your question wording and page layout, and avoid changing them. The exact wording of the question and even webpage layout have a measurable impact on the distribution of the answers. This is especially important if you have a large sample size and want to compare responses over time. Ask your main KPI question at the very beginning of the survey, and keep the look of the page consistent.
- Ask an open-ended question why the customer rated your brand a certain way. With the advancements of artificial intelligence, text responses can be analyzed effectively and efficiently. This open-ended question can become a gold mine of ideas on how to improve satisfaction and even grow your brand.
- Ask responders to rate the most important drivers/attributes only. The value of these questions is likely limited, so don’t overburden your customers with long surveys.
- Remember that NPS is a group-level metric, and customer satisfaction and the likelihood to recommend are individual-level metrics that can be rolled up to a group. Don’t request or promise to calculate NPS for individual responders.
- Be very cautious about using NPS as a factor in employee compensation. Changes in the business environment that people have no control over may impact NPS. Sales growth often results in lower NPS. When people’s income is on the line, you don’t want to be unfair and punish them for handling high workloads.
- Use historical NPS levels as your starting point, and try to improve from there. It’s all about moving forward, not comparing your NPS to competitors or worse yet, random companies in other industries.
Conclusion
If you are embarking on a customer satisfaction tracking program, congratulations! Customer satisfaction and NPS provide a valuable assessment of your brand’s health, and all the criticism and controversy are poor reasons to avoid starting a tracking program.
Be realistic of what the program can deliver, identify the important components, and keep your initial questionnaire short.
Time is your best friend. Comparisons over time are the most insightful results of the tracking program, so keep your survey consistent.
Go for the low-hanging fruit first. Delivering a few valuable pieces of insight quickly is better than trying to answer all questions at once. The latter rarely works out. With time, many companies add questions to the survey, so they tend to grow longer, but these questions may provide meaningful feedback about important decisions.
Developing a solid satisfaction tracking program can be challenging, so if you need to consult someone who has been in the trenches, I can help.

Tanya Zyabkina has over 15 years of experience leading analytics functions for multiple Fortune 500 companies in the retail and telecom industries. Her experience spans from qualitative market research in the fashion industry to determining the impact of promotions on subscriber behavior at a cable provider.
